Motion Plots Summary
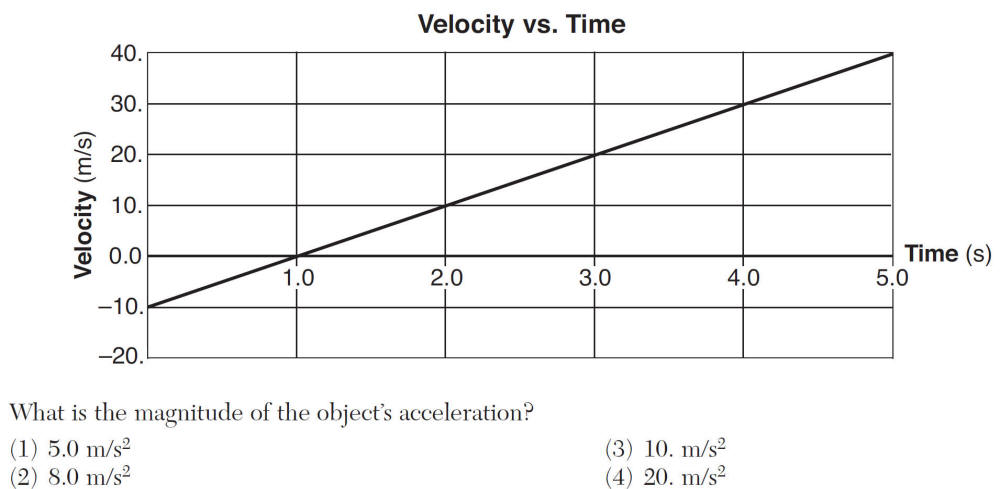
Reading Slope and Acceleration From a Plot

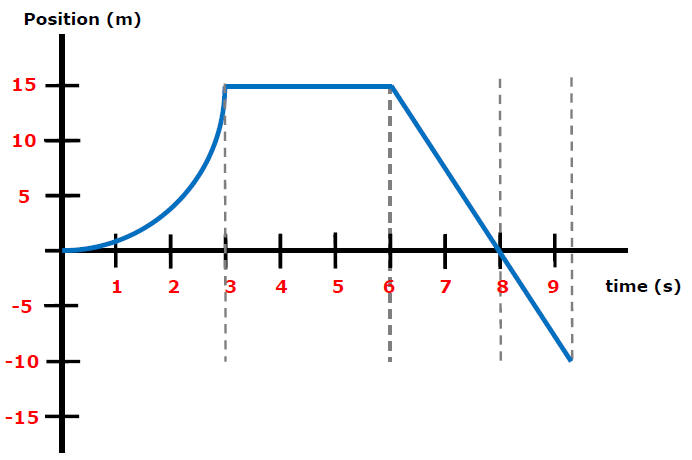
Explain why the acceleration is greatest between A and B and zero between C and D.
Video Instruction
showmethephysics.com
Ranking Task
Rank the acceleration from greatest to least. Ties are possible. Explain.
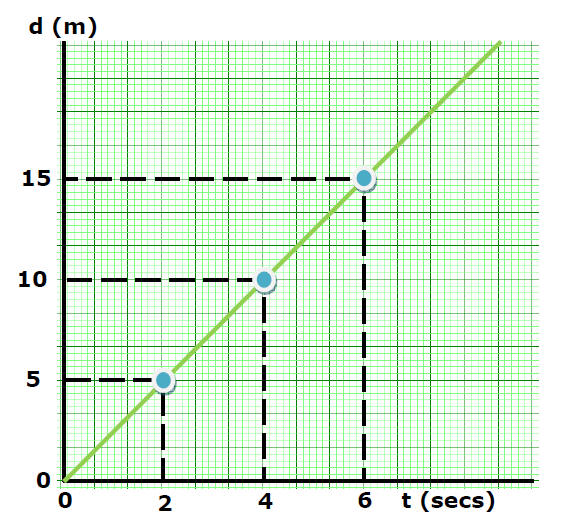
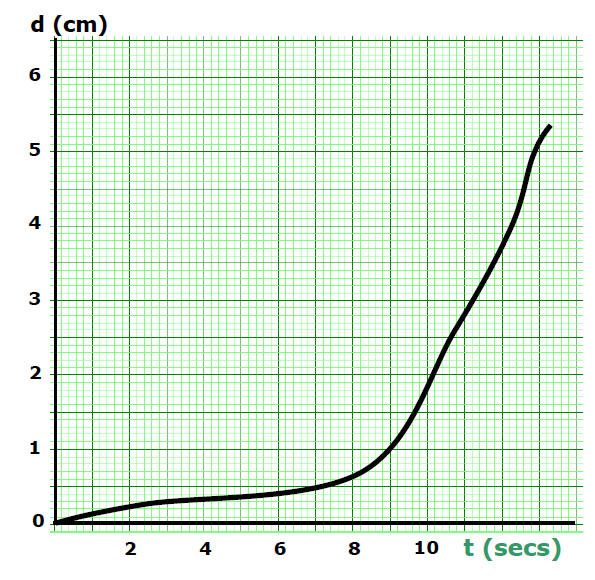
Ex) d (cm)
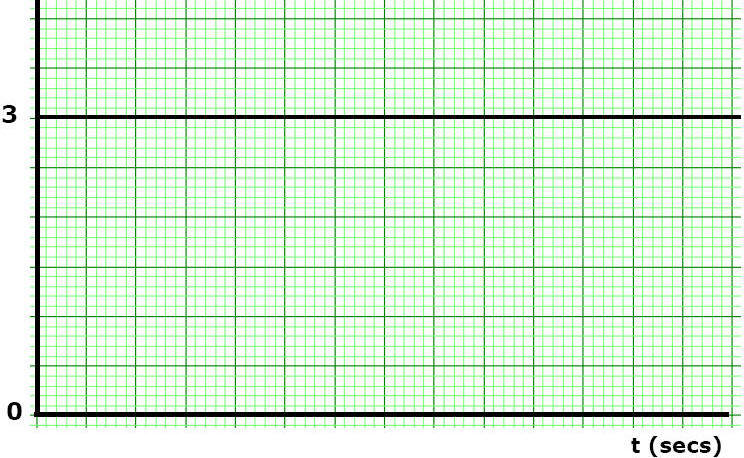
1. y changes: ? 2. Slope: ?
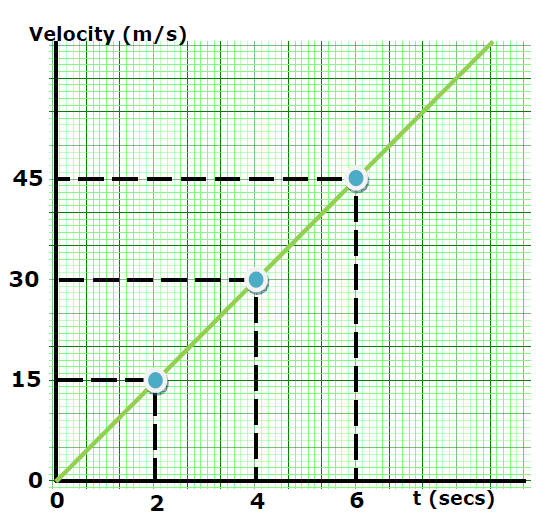
Ex)
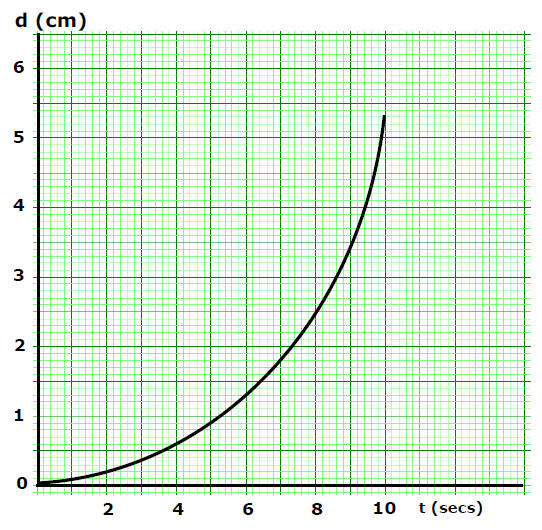
1. y changes: ? 2. Slope: ?
Ex)
1. y changes: ? 2. Slope: ?
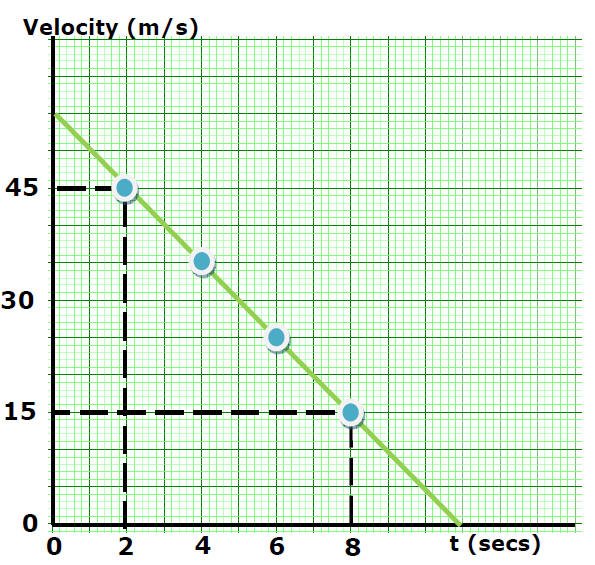
Ex)
1. y changes: ? 2. Slope: ?
Ex)
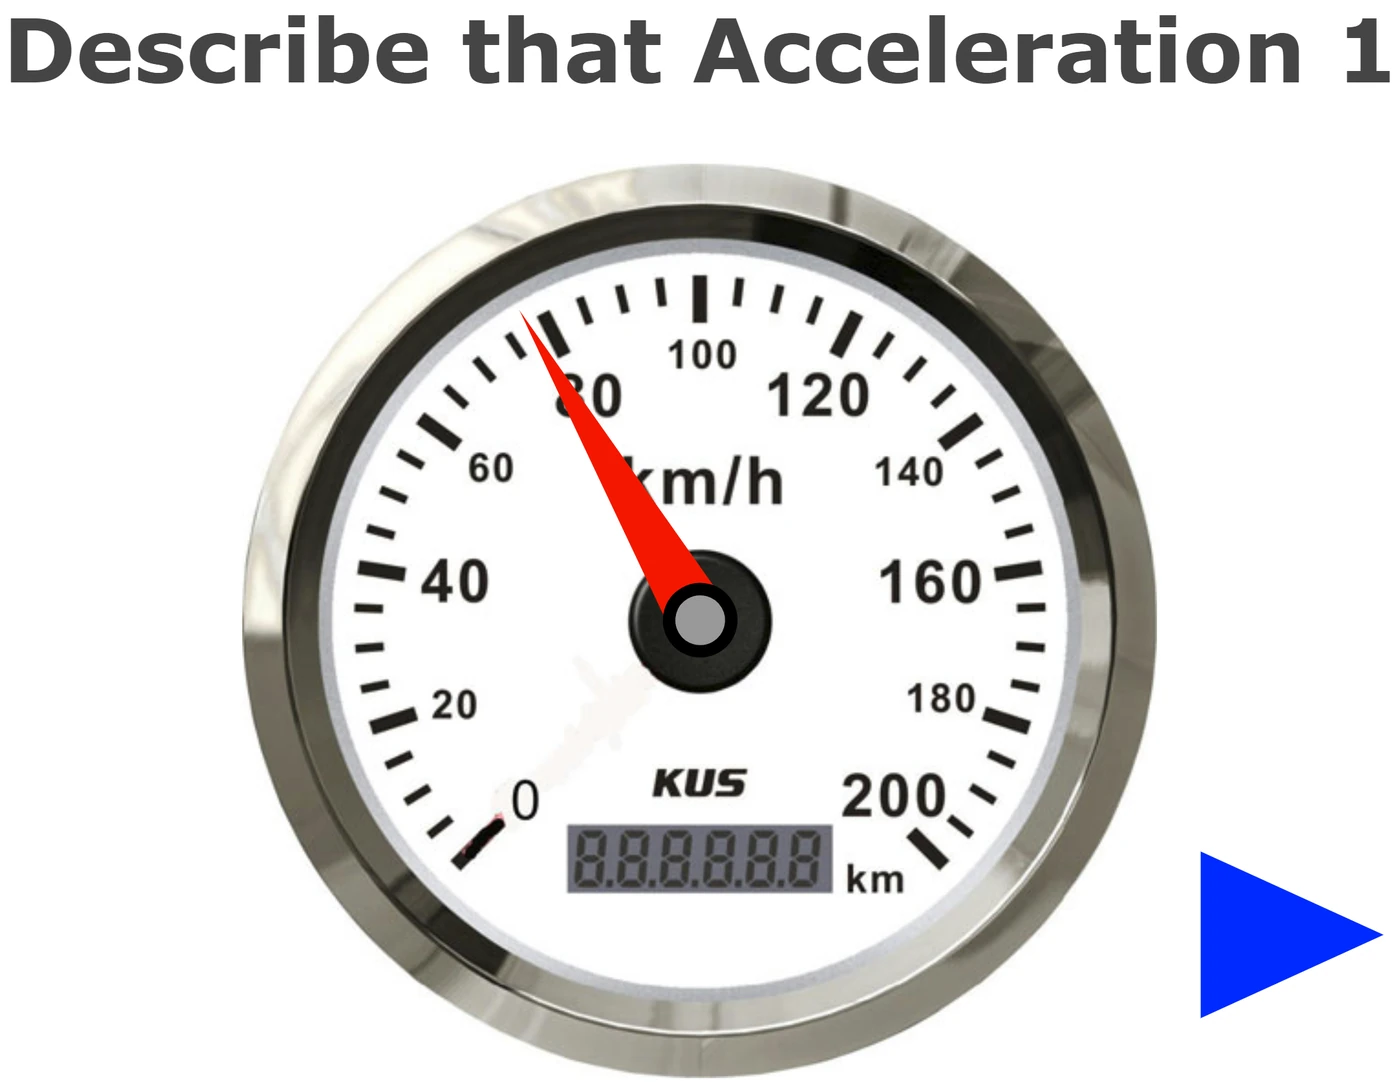
1. y changes: ? 2. Slope: ?
Optical Illusion
Check Your Understanding
5 quick questions — pick an answer to see if you’re right.
1. A displacement vs. time graph is a flat horizontal line. What are the velocity and acceleration?
2. A displacement vs. time graph is a straight line sloping upward. Which is true?
3. A displacement vs. time graph curves upward smoothly, getting steeper. What is the acceleration?
4. A velocity vs. time graph is a straight line sloping downward toward zero. What is happening?
5. A velocity vs. time line goes straight from 0 m/s at 0 s to 12 m/s at 3 s. What is the acceleration?