Constant Acceleration
Interpreting Motion Diagrams and Motion Plots

Acceleration - the time rate of change in velocity
Fill In The Blanks NotesWarm-Up
This pic shows the position of a basketball at even time intervals. Explain why you know the ball is accelerating.

Motion Graphs [ HTML5 ] (d vs t)
Video Instruction
showmethephysics.com
B. Interpreting Motion Diagrams
Acceleration Review
Uniform Acceleration? - constant change in velocity per unit time
Which data shows uniform acceleration? Why?
| t (sec) | V (m/s) |
|---|---|
| 0 | 5 |
| 1 | 7 |
| 2 | 9 |
| 3 | 11 |
| 4 | 13 |
| t (sec) | V (m/s) |
|---|---|
| 0 | 5 |
| 1 | 10 |
| 2 | 14 |
| 3 | 20 |
| 4 | 30 |
Non-Constant or Constant Acceleration?
Ex) Describe the acceleration
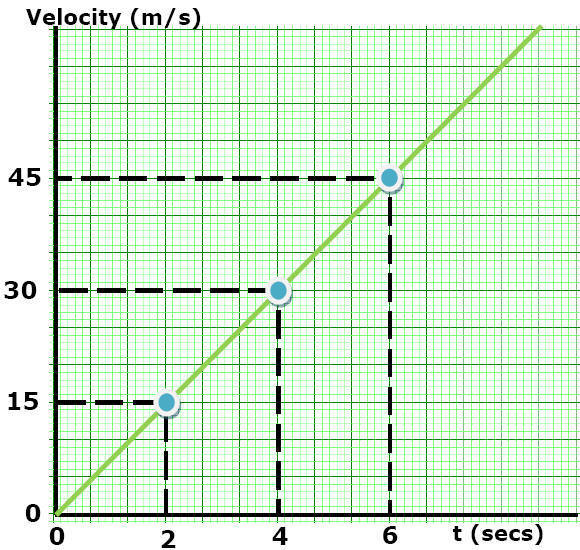
Constant Non-Constant Acceleration?
Prove this is constant acceleration
Every 2 seconds the object gains exactly 15 m/s.


Slope of a V vs. t Plot
Ex) Describe motion using y axis and slope
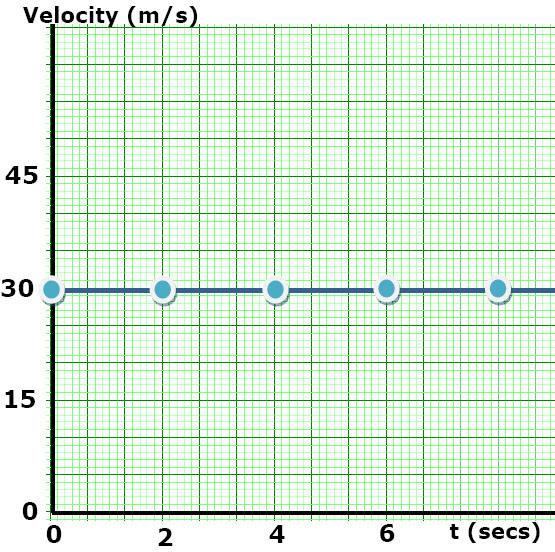
Step 1: y axis: ? Step 2: Slope: ?
Ranking Task
Rank the acceleration from largest to smallest
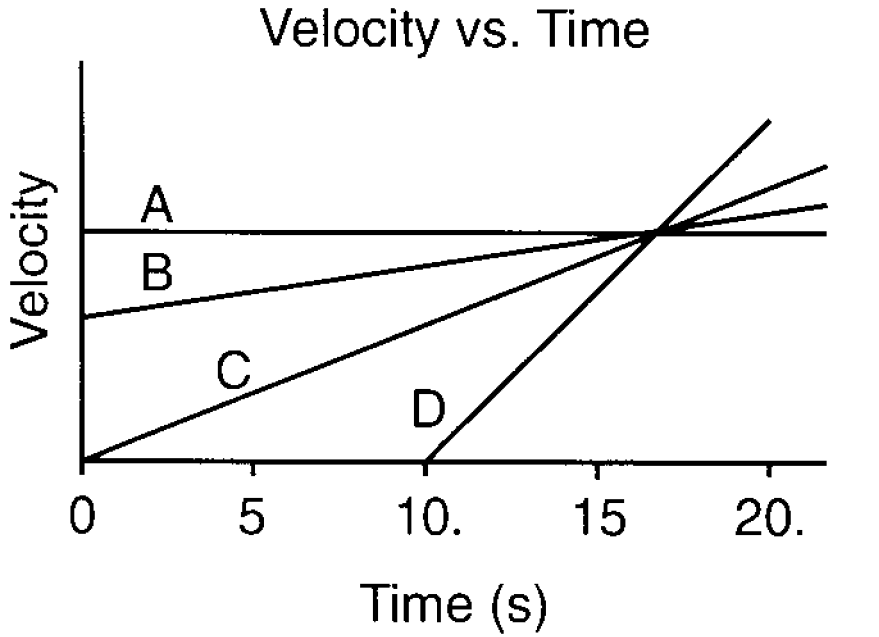
Ex 4
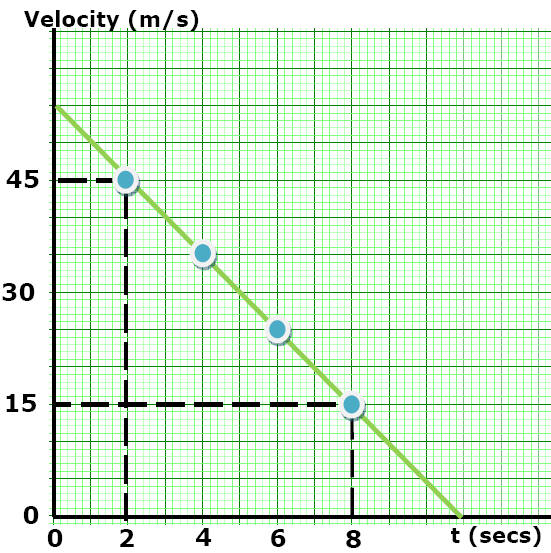
Step 1: y axis: ? Step 2: Slope: ?
Video Instruction
showmethephysics.com
Ex 5
Describe the motions — Velocity (m/s)
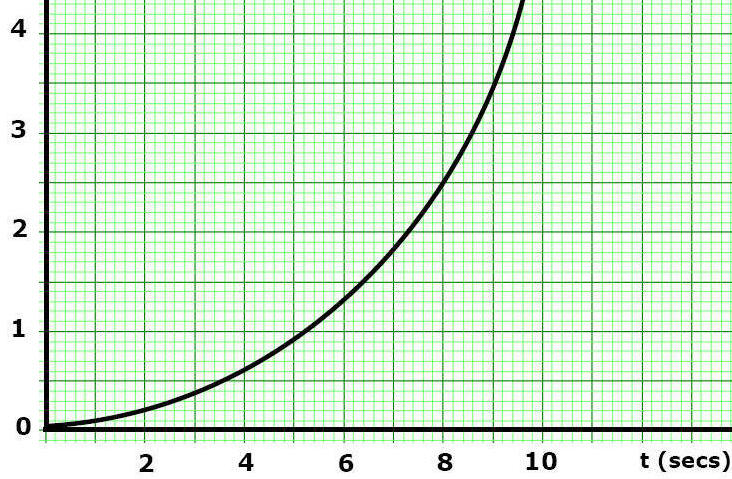
Step 1: y axis: ? Step 2: Slope: ?
Ex) Describe the Motions
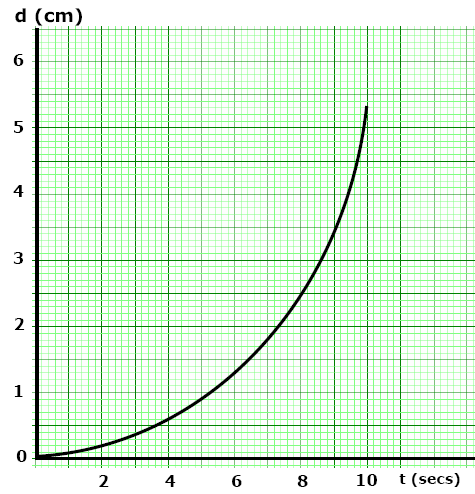
Step 1: y axis: ? Step 2: Slope: ?
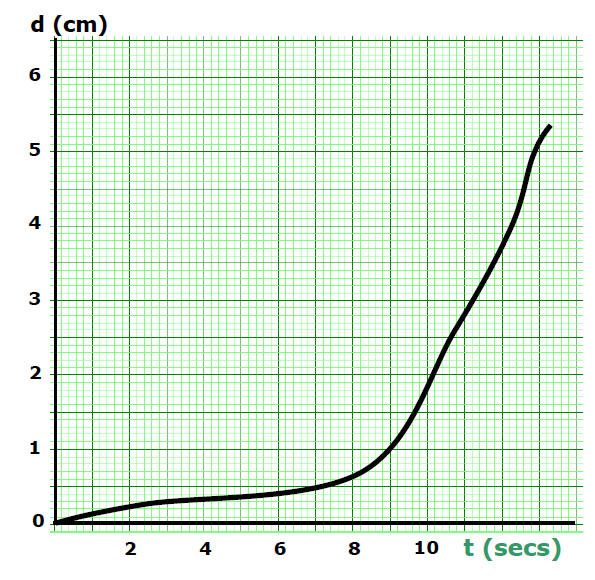
Ex) Describe Motions
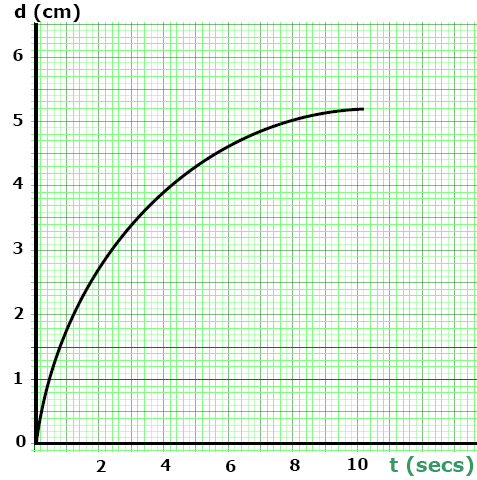
Step 1: y axis: ? Step 2: Slope: ?
Describe Motions
d (cm)
Step 1: y axis: ? Step 2: Slope: ?
Analyzing Motion Plots
Analyzing Motion Plots - HTML5, Show Me The Physics
Try This at Home
Check Your Understanding
5 quick questions — pick an answer to see if you’re right.
1. What is uniform acceleration?
2. An object's velocity is 4, 7, 10, and 13 m/s at t = 0, 1, 2, and 3 s. What describes its motion?
3. Starting from rest, an object gains exactly 15 m/s every 2 seconds. What is its acceleration?
4. A velocity vs. time graph is a flat horizontal line above the time axis. What is the acceleration?
5. An object's velocity drops from 45 m/s at 2 s to 15 m/s at 8 s. What is its acceleration?