Kinematics · AP Physics 1
Motion Plots
Multi-Segment Graph Analysis

Part I: Multi-Segment Graph Analysis
Describe the object's direction and state of motion during each of the following intervals: 0–3 sec, 3–6 sec, 6–8 sec, and 8 sec+
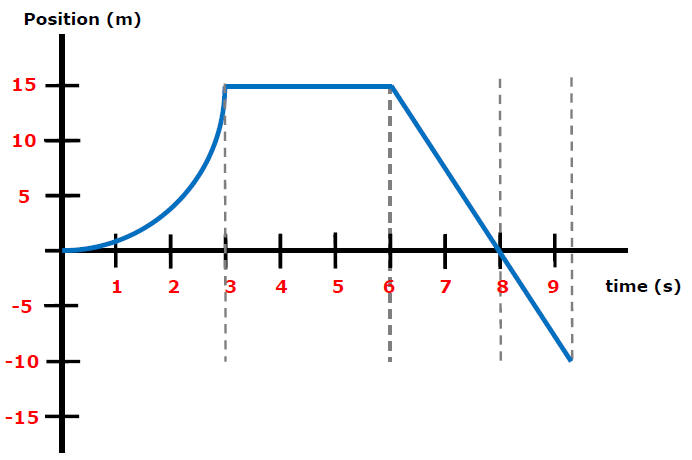
| Interval | Motion Answers (Set A) |
|---|---|
| 0–3 s | Increasing velocity (positive constant acceleration) |
| 3–6 s | At rest (V = 0 m/s) |
| 6–8 s | Constant backward velocity (V = −7.5 m/s) |
| 8 s+ | Maintaining constant backward velocity (V = −7.5 m/s) |
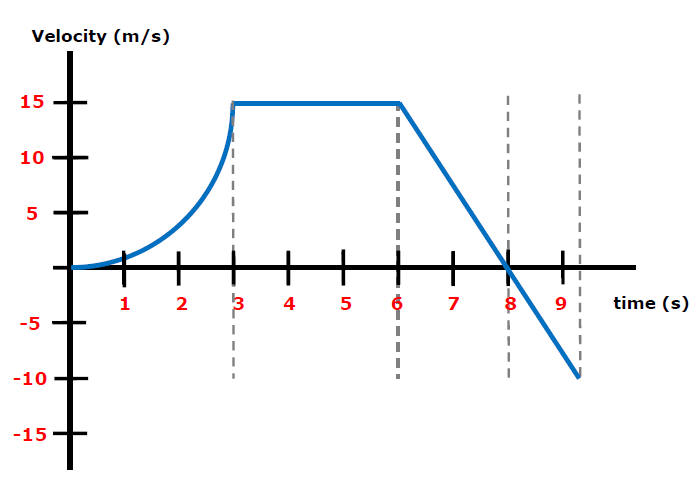
| Interval | Motion Answers (Set B) |
|---|---|
| 0–3 s | Increasing acceleration (a) |
| 3–6 s | Constant high velocity (V = 15 m/s) |
| 6–8 s | Constant deceleration (a = −7.5 m/s²) |
| 8 s+ | Maintaining deceleration rate (a = −7.5 m/s²) |
Part II: Interval Behavior Analysis
Reference the curves below to analyze the velocity dynamics within the summary table.
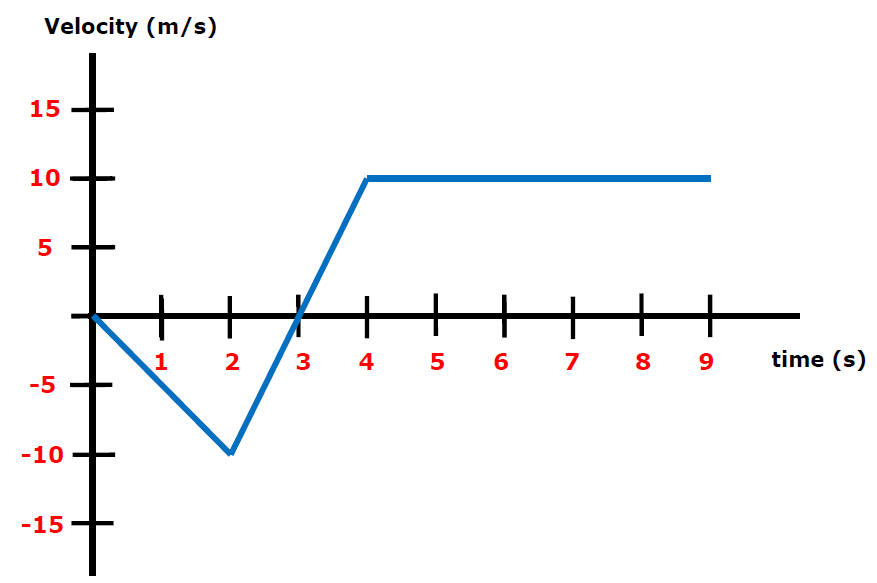
| Time Interval (sec) | Motion Description | Acceleration (a) |
|---|---|---|
| 0–2 | Speeding up | a = −5 m/s² |
| 2–3 | Slowing down to a stop | a = 10 m/s² |
| 3–4 | Speeding up | a = 10 m/s² |
| 4–∞ | Constant Speed = 10 m/s | a = 0 |