Motion Plots I
Position vs. Time, and the Meaning of Slope

Motion Plots - a visual representation of an object's position or velocity over time
Read This Passage and Answer These QuestionsWhen physicists want detailed information about an object's movement, they gather data about it every second or millisecond. Sometimes, they gather the displacement (distance and direction from a starting point) at each moment in time, and other times, it is more useful to record the object's velocity.
The data collected is then transformed into a visual representation, with the independent variable, time, on the x-axis and either the object's distance and direction or its velocity on the vertical axis. This plot, a snapshot of the object's motion, is a powerful tool that brings abstract concepts to life. But the real magic lies in the slope of a motion plot, which holds even more information, waiting to be deciphered.
Here's how it works. You'll probably remember that the slope of any plot is ΔY/ΔX. Therefore, the slope of a displacement vs time plot at any given time would tell you about the object's velocity (Δd/Δt) during the interval you are concerned with. On the other hand, the slope of a velocity vs time plot during a time interval would reveal the object's acceleration. This is because acceleration is ΔV/Δt.
Video Instruction
showmethephysics.com
Enduring Understanding
The slope of a distance or position vs time plot allows us to calculate the speed of an object.
B) Motion Plots
(a.k.a. Motion Diagrams) — 2nd way to describe motion

Position vs. Time Plot
Movement in a Straight Line
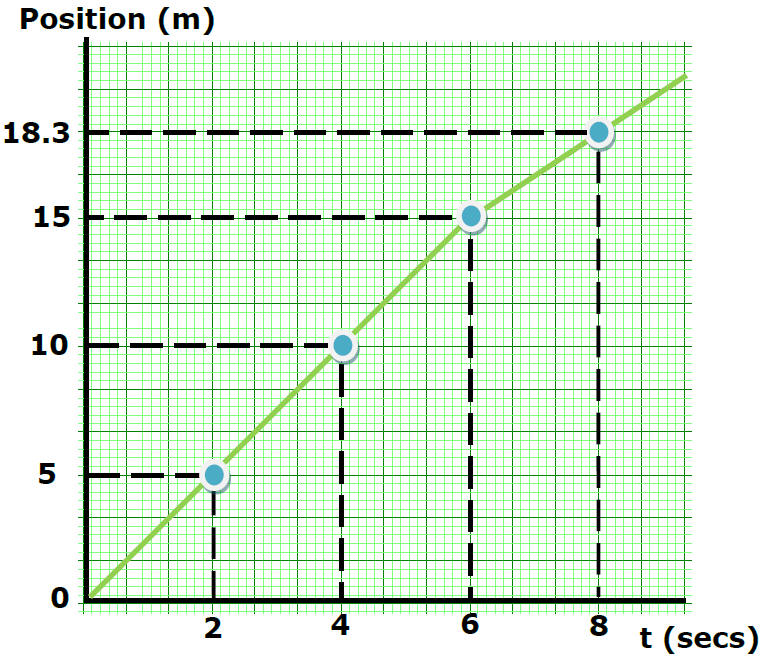
Fill in the position at each time from the plot above.
| Position (m) | Time (sec) |
|---|---|
| ? | 0 |
| ? | 2 |
| ? | 4 |
| ? | 6 |
| ? | 8 |
| Position (m) | Time (sec) |
|---|---|
| 0 | 0 |
| 5 | 2 |
| 10 | 4 |
| 15 | 6 |
| 18.3 | 8 |

Speed From the Plot
Speed from 0 to 2 seconds?
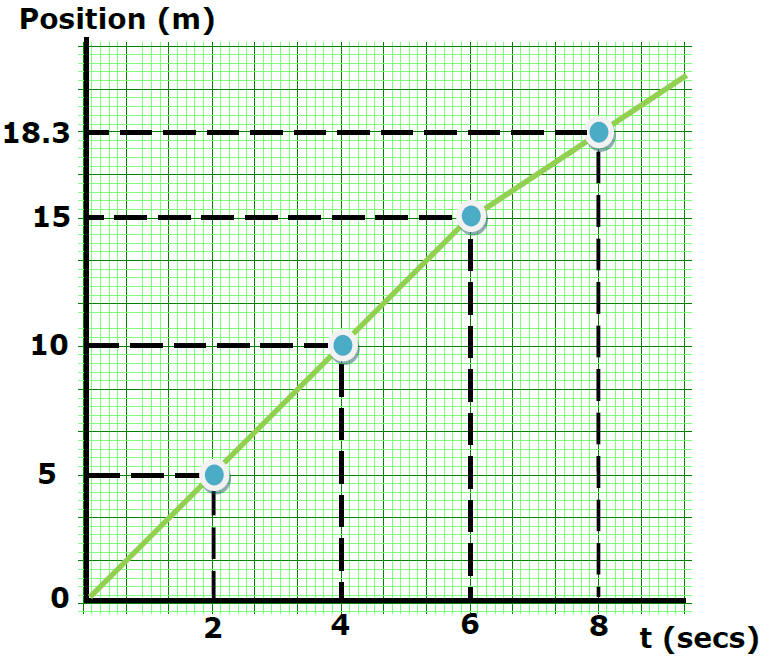
Speed from 2 to 4 seconds?
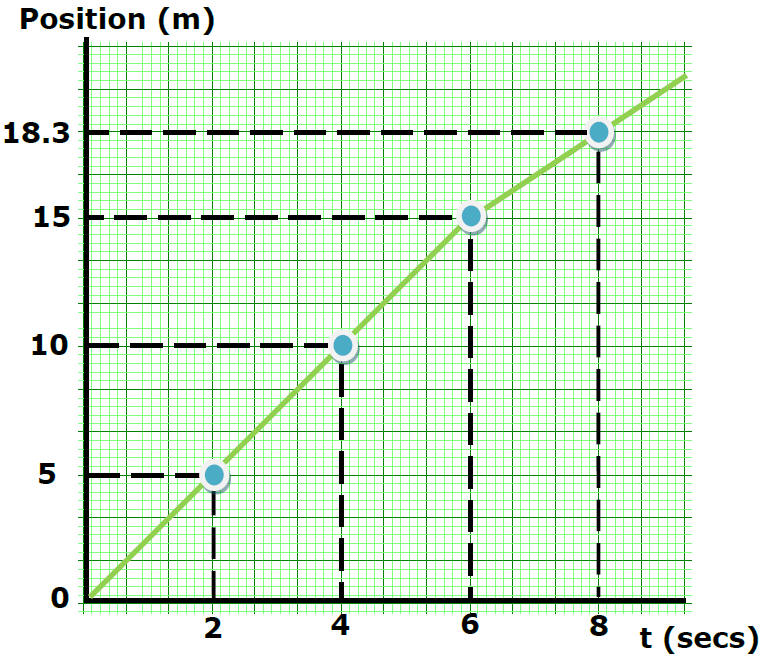
Speed from 4 to 6 seconds?
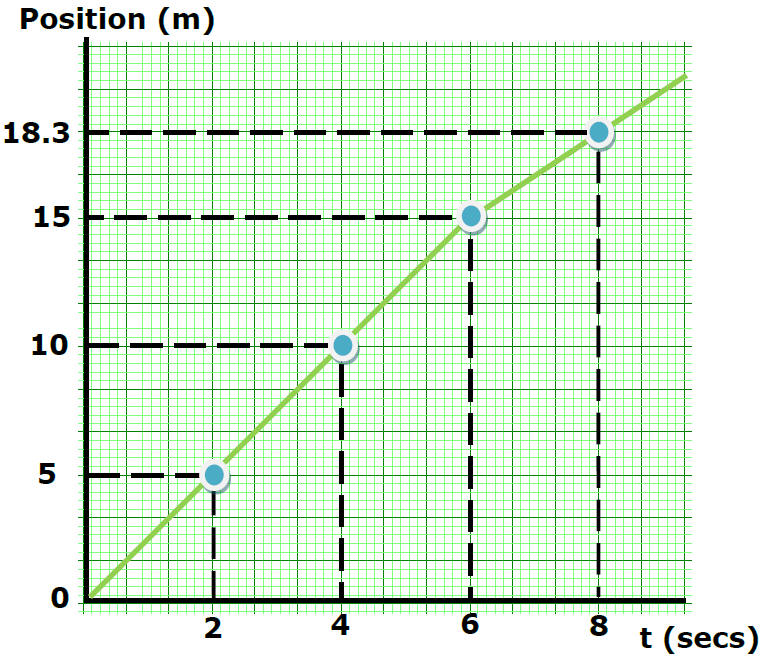
Does the object travel faster or slower from 6 to 8 seconds?
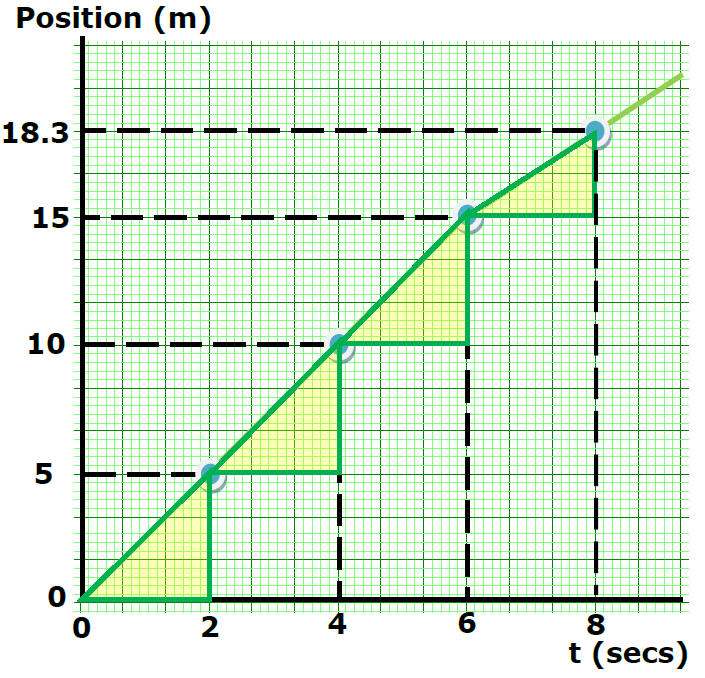
Compare speed from 6 to 8 sec with speed from 8 to 9 sec.
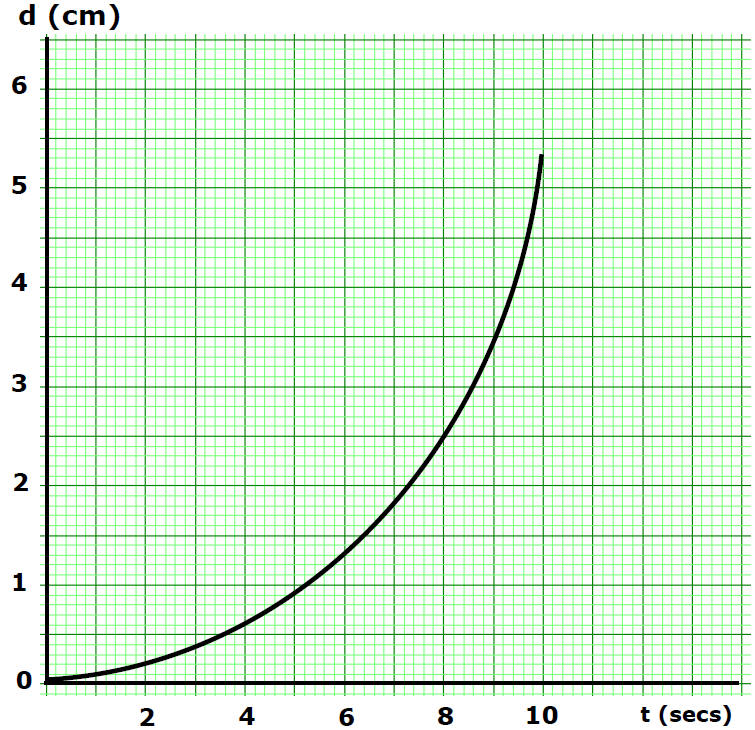
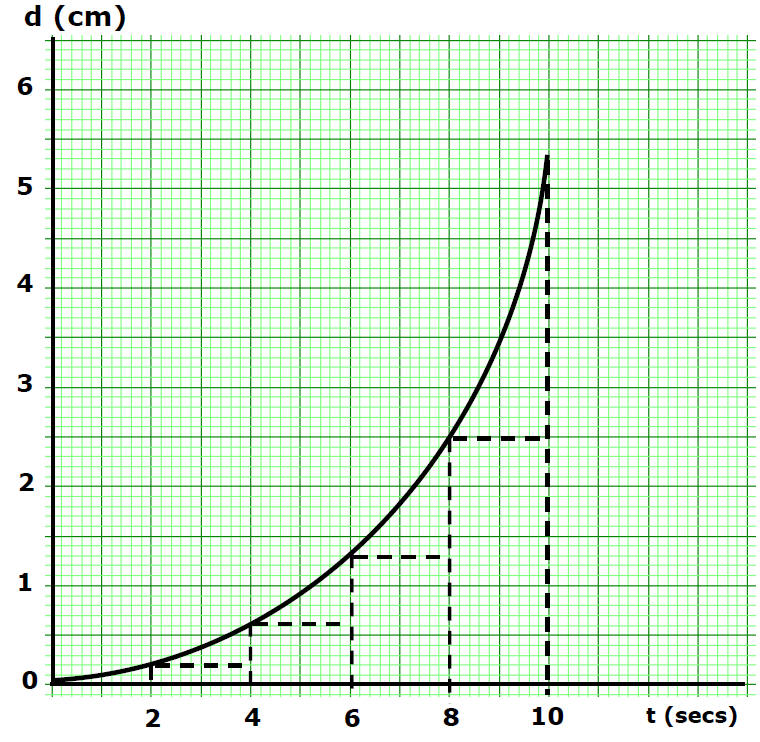
What kind of motion produced this plot?

Equations


Speed

Velocity
(speed and direction)


Check Your Understanding
5 quick questions — pick an answer to see if you’re right.
1. On a position vs. time plot, what does the slope tell you?
2. On a velocity vs. time plot, what does the slope tell you?
3. An object's position is 10 m at 4 s and 15 m at 6 s. What is its speed during this interval?
4. A position vs. time line is curved and gets steeper as time goes on. What kind of motion is this?
5. An object moves 5 m in its first 2 s and only 3.3 m in the next 2 s. During the second interval it is moving...