Displacement Plots
Finding Displacement Using V vs t Graphs

Displacement Plots — finding displacement from V vs t graphs
Fill In The Blanks NotesWarm-Up
This picture is of a single car moving across a room. The picture shows its position at equal time intervals. Describe its velocity.

Video Instruction
showmethephysics.com
V. Finding Displacement Using V vs t Graphs
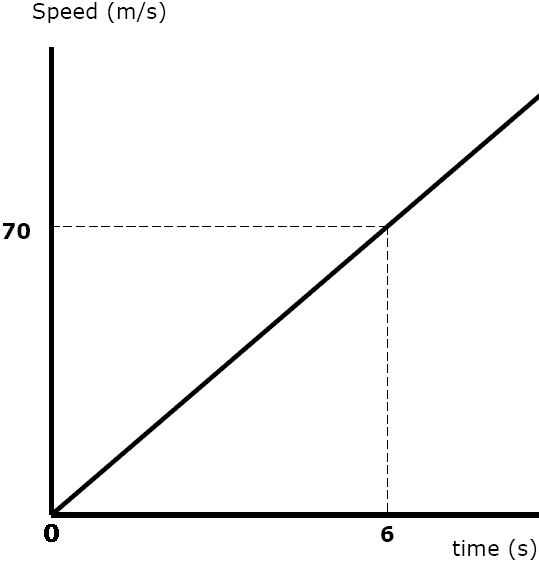
What is the displacement this object covered from t = 0 to t = 6 seconds?
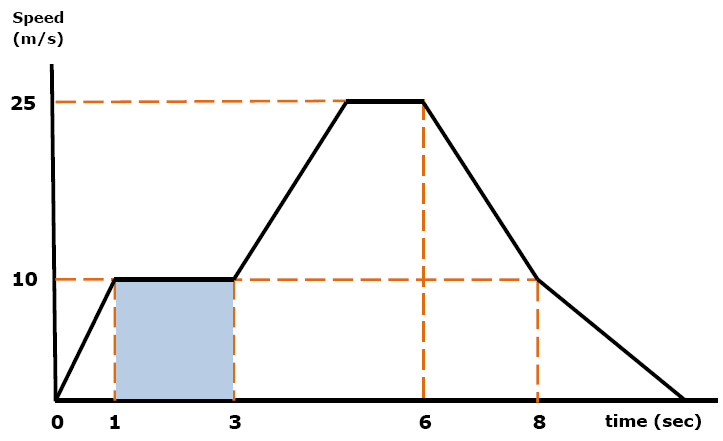
Object's displacement from t = 1 sec to t = 3 sec?
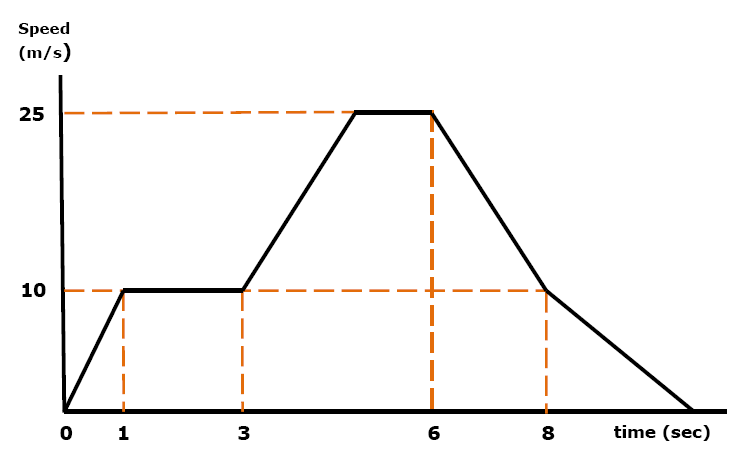
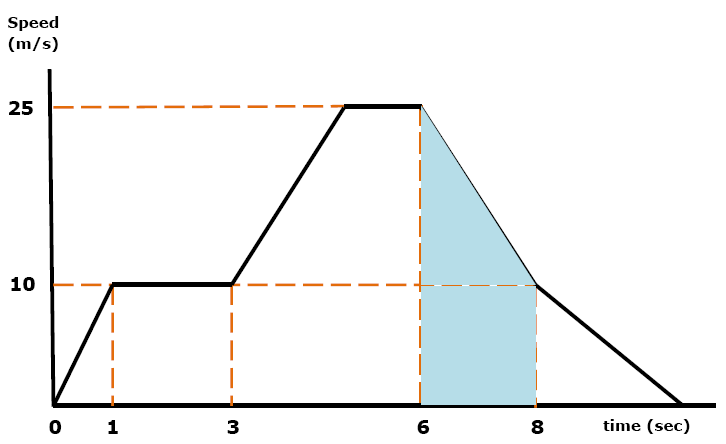
Object's displacement from t = 6 sec to t = 8 sec?
Ranking Task
Smallest displacement?
Flash showmethephysics.com
Ranking Task Answer — Largest B, Smallest D
AP Question
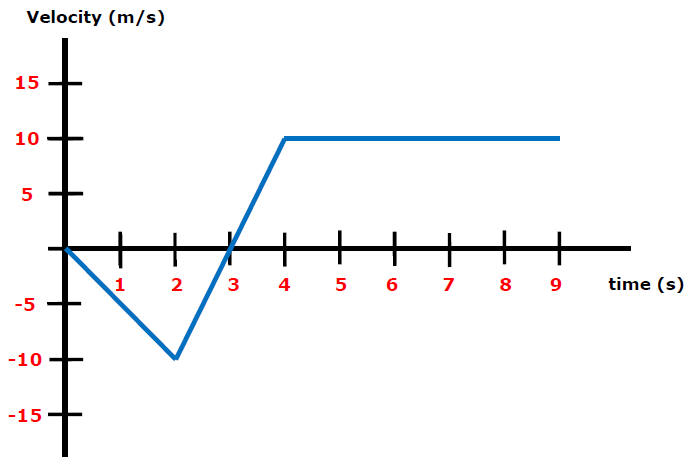
a) Find displacement after 4 seconds
b) At what time does the object return to its starting point?
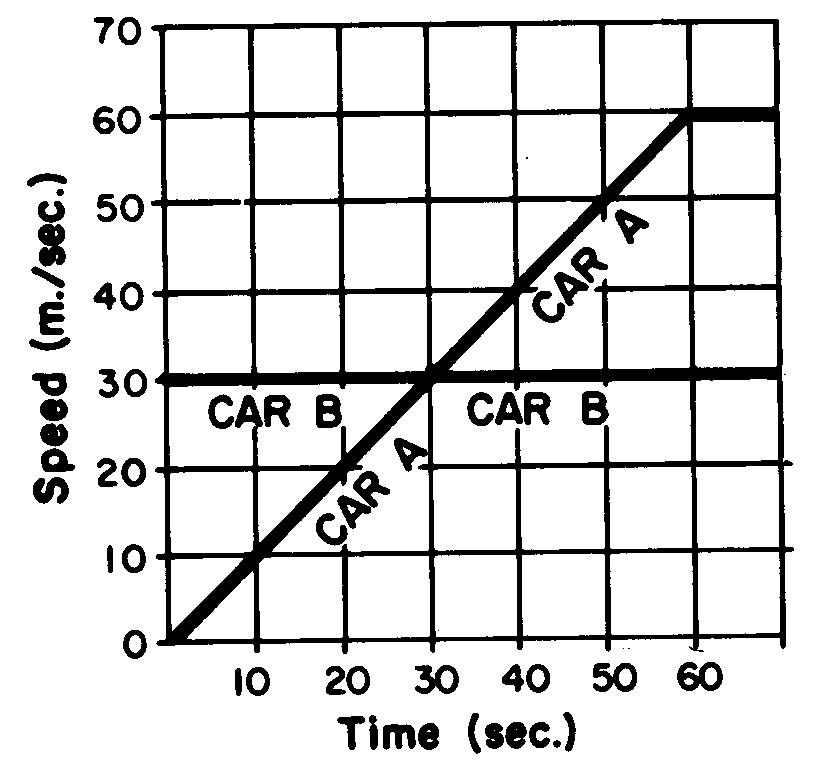
When did car A catch up to car B?
Check Your Understanding
5 quick questions — pick an answer to see if you’re right.
1. On a velocity vs. time graph, what does the area under the line represent?
2. An object moves at a constant 10 m/s from t = 1 s to t = 3 s. What is its displacement?
3. An object speeds up uniformly from 0 to 30 m/s in 4 s. What is its displacement?
4. An object's velocity changes uniformly from 10 m/s to 30 m/s over 2 s. What is its displacement?
5. On a V vs. t graph, the area above the time axis is 5 m and the area below is 15 m. What is the net displacement?


Bonus
Amusing Surface Tension Experiment