Motion Diagrams
Motion Plots II

Motion Diagrams - plots of motion data, a detailed, visual way of describing motion
Fill In The Blanks NotesWarm-Up
Describe the velocity for each.
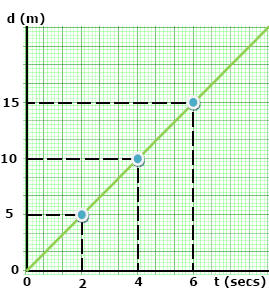
Constant Velocity
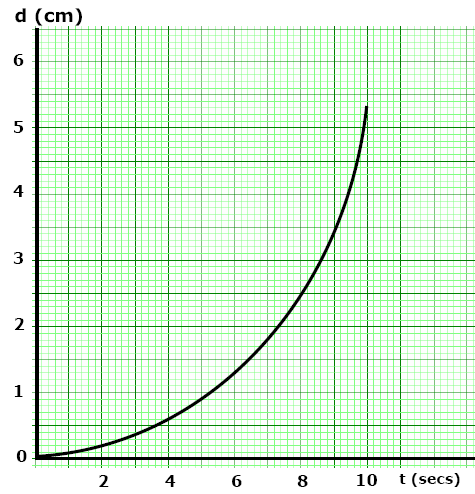
Increasing Velocity
II. Motion Diagrams
Plots of motion data — a detailed, visual way of describing motion
Both plots show an increasing displacement. Describe the velocity for each.
Constant Velocity
Increasing Velocity
A. Displacement vs. Time Plot
Ex) (d) Displacement (m)
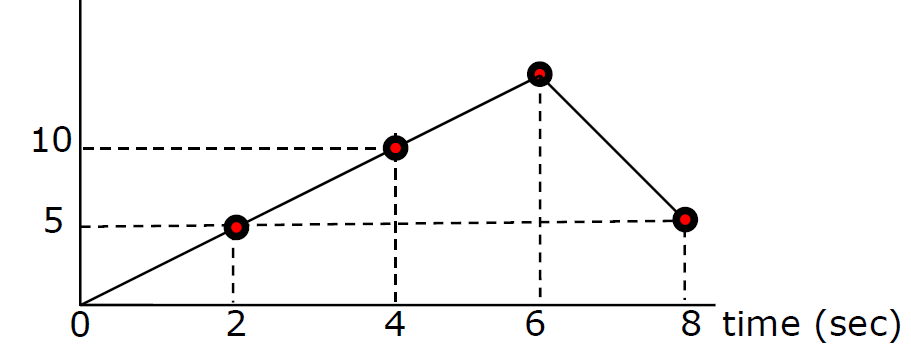
Calculate the Velocity from 2 to 4 sec
Velocity from 4 to 6 seconds?
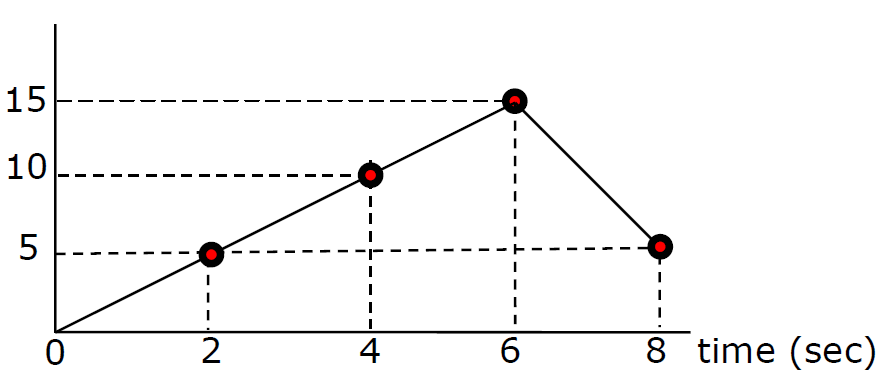
What is happening from 6 to 8 seconds?

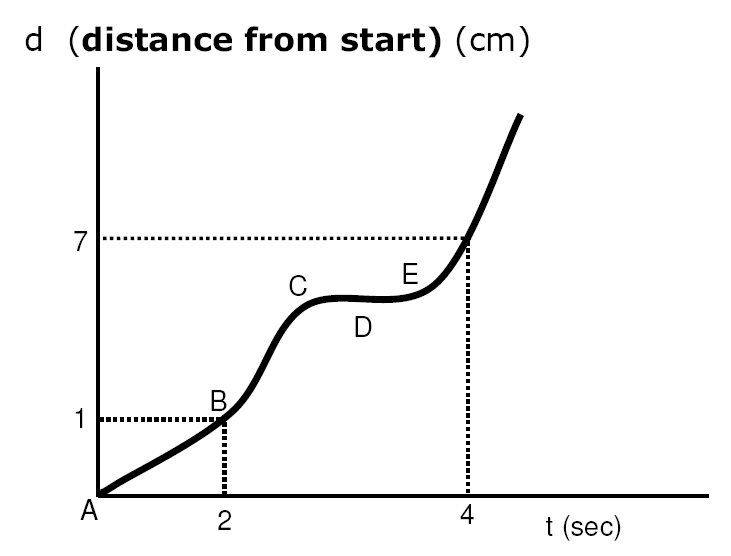
Describe the Various Motions Shown in This Plot
Check Your Understanding
5 quick questions — pick an answer to see if you’re right.
1. What does the slope of a displacement vs. time graph represent?
2. An object's displacement is 5.0 m at 2.0 s and 10. m at 4.0 s. What is its velocity?
3. An object's displacement goes from 15 m to 5 m in 2 s. What is its velocity?
4. A displacement vs. time graph shows a flat, horizontal line. What is the object doing?
5. Two displacement vs. time graphs both show increasing displacement. One is a straight sloped line. What does that line show?