![]()

![]()

Motion Plots II
|
||||||||
Review

Video Instruction
showmethephysics.com
II. Motion Diagrams - plots of motion data
Detailed, visual way
of
describing motion
Both plots show an increasing displacement
Describe the velocity for each.
 |
 |
|
Constant Velocity |
Increasing Velocity |
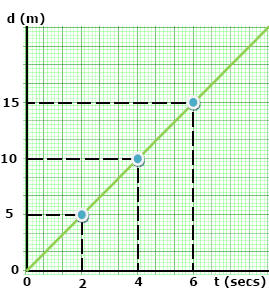
A. Displacement vs. Time Plot
Ex)
(d) Displacement (m)
Calculate the Velocity
from 2 to 4 sec
V = ∆d/∆t
= (10. m - 5.0 m)/(4.0 s - 2.0 s)
= +2.5 m/s
Velocity from 4 to 6 seconds?
= +2.5 m/s
(d) Displacement (m)
What is happening from 6 to 8 seconds?
Motion Map
5 m in 2 sec / 5 m in 2sec / 5 m in 2 sec

10 m backward in 2 sec
(d) Displacement (m)
|
Slope of a |
Describe the various motions shown in this plot
A to B?
Constant Velocity
B to C?
Increasing V,
then Decreasing V
D?
Rest
V = 0
D to E ?
Increasing V
![]()
![]()
Try this at home!
School blocks YouTube?
Use the file below
©Tony Mangiacapre.,
- All Rights Reserved [Home]
Established 1995
Use any
material on this site (w/ attribution)