XII. Electricity Graphing - Flash Cards


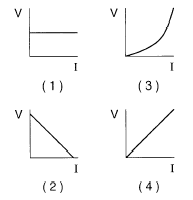
1. Which graph best represents the relationship between the potential difference across a conductor and the current through the conductor at constant temperature?

Answer


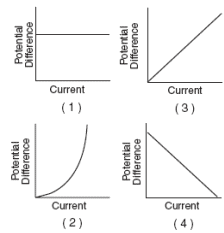
2. A metallic conductor obeys Ohm's law.

Which graph best represents the relationship between the potential difference (V) across the conductor and the resulting current (I) through the conductor'?

Answer
3. A constant unbalanced force is applied to an object for a period of time. Which graph best represents the acceleration of the object as a function of elapsed time?


Answer


4. Which graph best represents the relationship between the electrical power and the current in a resistor that obeys Ohm’s Law?
Answer


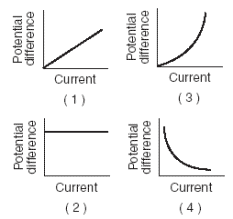
5. Which graph best represents the relationship between potential difference across a metallic conductor and the resulting current through the conductor at a constant temperature?

Answer


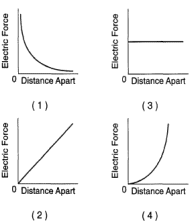
6. Two similar metal spheres possessing +1.0 coulomb of charge and –1.0 coulomb of charge, respectively, are brought toward each other.  Which graph best represents the relationship between the magnitude of the electric force between the spheres and the distance between them?

Answer

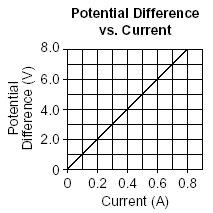
The graph below represents the relationship between the potential difference across a metal conductor and the current through the conductor at a constant temperature.

7. What is the resistance of the conductor?

(1) 1 ohms (3) 0.1 ohms (2) 0.01 ohms (4) 10 ohms


Answer


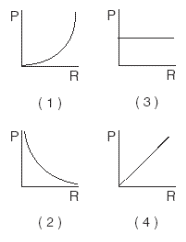
8. The potential difference applied to a circuit element remains constant as the resistance of the element is varied. Which graph best represents the relationship between power (P) and resistance (R) of this element?

Answer


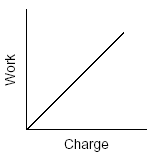
9. The graph below shows the relationship between the work done on a charged body in an electric field and the net charge on the body.

What does the slope of this graph represent?

Answer


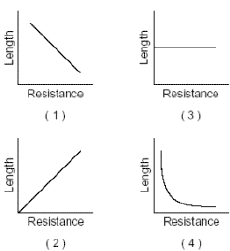
10. A copper wire is part of a complete circuit through which current flows. Which graph best represents the relationship between the wire’s length and its resistance?

Answer


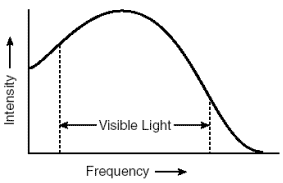
Sunlight is composed of various intensities of all frequencies of visible light. The graph represents the relationship between light intensity and frequency.


Based on the graph, which color of visible light has the lowest intensity? 

Answer
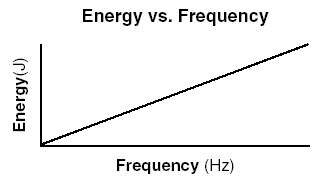
The graph below represents the relationship between the energy and the frequency of photons.

The slope of the graph would be
(1) 6.63 × 10⁻³⁴ Js (2) 6.67 × 10⁻¹¹ N m2 /kg2
(3) 1.60 × 10⁻¹⁹ J (4) 1.60 × 10⁻¹⁹ C

Answer
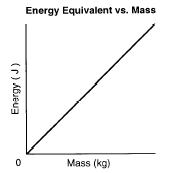
The graph below represents the relationship between mass and its energy equivalent.

The slope of the graph represents

1 the electrostatic constant

2 gravitational field strength

3 the speed of light squared

4 Planck's constant

Answer